
Top 10 Essential Product Usage Analytics Tools


Globally, 3 out of 5 businesses use some form of analytics to enable their business goals today. Of these, 91.9% feel confident in the value they get from the emphasis on analytics. So if you are still wondering whether you should invest in a product usage analytics tool, the answer is most definitely yes.
This is especially true if you work in a product-led business — where your primary offering is a product, whether that’s a SaaS product or a B2C/consumer app.
Your business would mostly likely have some form of an analytics arm to enable your product team with insights into customer behaviour. For some businesses this arm is essentially a group of analysts manually running SQL queries. While this is better than nothing, it’s not the most effective solution — PMs have to deal with long time delays, frustrating back and forths, and stay dependent on analysts for even slightly complex insight.
This is what a dedicated product analytics tool solves brilliantly.
It not only helps your PMs analyze product data but enables them with real-time visibility into their initiatives and makes analysis incredibly self-serve. They can then use their trusted product usage analytics tool to stay on top of user behavior, KPIs, and opportunities.
Now, the big question: which of the many available product usage analytics tools should you trust? Making this decision is hard, and we intend on helping here. This blog will do a deep-dive into the top 10 product usage analytics tools in the market, along with their key features and other details you should be aware of.
What Is a Product Usage Analytics Tool?
A product usage analytics tool helps you process, analyze, and ultimately visualize your product usage and user behavior data in the form of user-friendly dashboards. More often than not, they run on top of the clickstream data — record of events and user activities.
These tools have out-of-the-box visualization capabilities like flows, funnels, trends, and charts that you can leverage to get to directional answers and insights quickly. Some examples of these insights would be: data on a specific feature’s adoption, navigation flow between two steps, drop-off points, behavior of a cohort, etc.
Key Features to Look for in a Product Analytics Software:

Different product usage analytics tools offer a plethora of different features, while some of them are absolutely crucial, some of them are just good-to-haves. Here we will list out the non-negotiable features that you make for a good product usage analytics tool:
1. User Segmentation
Often PMs and PMMs need to create a sub-group/segment of their users to run targeted campaigns, get specific insights, unravel trends, or create personalized experiences. To do this, all good product analytics tools offer “user segmentation” — this very ability to create subsets of your user database.
Generally, you’d use traits such as demographics, behavior, or usage patterns to base these segments on. For example: users in colorado, users who paid using plan a, users in the age group of 20-40, etc.
Segmentation leveraged well can uplift the effectiveness of marketing campaigns, product rollouts, and product experience. Hence, any product usage analytics tool you pick should have the capabilities to create user segments.
2. A User-Friendly Interface
This one is a must. When trying to make sense of product usage data, you would likely end up dealing with enormous amounts of data — complex in every meaning of the word. This is why it is absolutely essential that you pick a product analytics tool with a highly-rated and friendly interface. Easy UI here wouldn’t just reduce the overwhelm with navigating a new product but also enable your PMs to delve deeper into the complexities of different visualizations.
3. Funnels Functionality
A funnel is essentially a collection of steps taken by a user to achieve a specific target state. The target state here can be things like making a purchase on your app, or something as simple as signing up.
The funnel capability makes it easier for you to map user/cohort journeys, identify drop-off points, and then rollout informed initiatives to improve the rate of conversion and user experience. Any product usage analytics tool you pick should offer you the capability to create funnels.
4. Reporting and dashboarding
In addition to analysis, tracking and reporting your KPIs and important business metrics is a crucial responsibility of every product team. Good reporting capability helps you quickly set up different views for different stakeholders and effectively communicate the good and the bad to the entire organization.
Top 10 Product Analytics Tools
Let's now look at the top 10 product usage analytics tools available in the market. Here is a list of these tools with their essential features, pros, and cons to help you decide.
Mixpanel
Mixpanel is a self-serve product analytics solution that helps you turn your clickstream data into insights.

Key Features
- Monitor essential metrics: engagement, standard events, custom events, retention, and conversions.
- Discover deep insights from your product usage data.
- Integrate with a host of third-party tools like Slack, Google Cloud, Optimizely, and Zoho.
Pros
- Mixpanel has a strong and friendly user interface making it easy for your team to get started.
Cons
- From public reviews, it seems that the cohort feature in Mixpanel has limited functionality and could use some developments.
- Since Mixpanel works on top of your clickstream/event data, your product usage analysis will be restricted. If you’d like to get more cross-functional analysis, you might need to do some manual analysis.
Rating
4.6/5
Google Analytics
Google Analytics is one of the most popular product usage analytics tools. It helps you examine user behavior and activity on websites and mobile apps.

Key Features
- Easy to get comprehensive reports with details of customer locations, per-click quotas, and user activity insights.
- Helps you create advertising reports, audience analyses, behavior breakdowns, real-time reports, and conversion summaries.
- Easily integrates with a host of tools like GitHub, Stack Overflow, Twitter, etc.
Pros
- Google Analytics offers a free tier, making it accessible to small and medium businesses.
- Easily integrates with other Google products such as Google Ads, Google Search Console, and Google Tag Manager, providing a holistic view of your online presence.
Cons
- Not ideal for mobile app analytics. While Google Analytics has some mobile tracking capabilities, it doesn’t provide as comprehensive insights into mobile app analytics as dedicated mobile analytics tools.
- Complex for beginners. Google Analytics has a steep learning curve for beginners. The interface and the multitude of features can be overwhelming.
Rating
4.2/5
Houseware
Houseware is a product analytics platform that helps you get insights into user behavior, product performance, and the effectiveness of different campaigns easily. It works right on top of your data warehouse — allowing you to leverage every data point you have to generate cross-functional and contextual insights and enable your business goals.

Key Features
- You can easily set up self-serve dashboards to monitor your key metrics.
- Advanced cohort and segment creation capabilities built with close feedback from leading PMs.
- Impressive visualization capabilities with features like flows, funnels, trends, etc.
Pros
- Minimal learning curve and a very self-serve tool for PMs.
- Iron-clad data security, residency, and control thanks to its warehouse-native architecture.
- No lock-in since it works on top of your existing data warehouse.
Cons
- The UI is undergoing some developments to make navigation simpler.
Rating
4.6/5
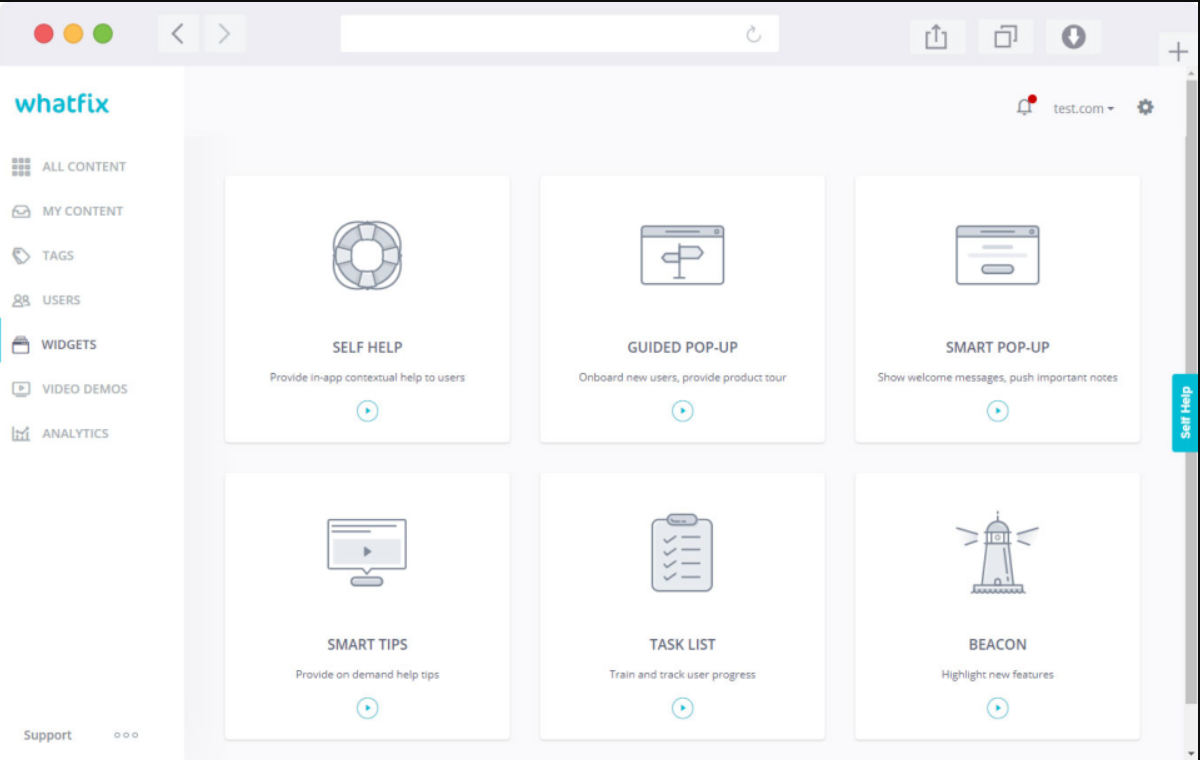
Whatfix
Whatfix is a platform that provides a solution for creating interactive walkthroughs, tutorials, and in-app guidance to help users navigate through web applications. It is often used in the context of employee training, customer onboarding, and software adoption.

Key Features
- Interactive and personalized guides: Whatfix allows users to create step-by-step interactive guides that can be embedded within applications.
- Can integrate with Google Analytics, SAP, Salesforce, and more
Pros
- Offers a free trial, so you can try it out before committing
Cons
- Whatfix isn’t exactly a product usage analytics platform as much as it is a digital adoption platform meant to simplify onboarding. While it offers certain product usage metrics, it’s best to pick a tool that fits the bill better.
Rating:
4/5
Amplitude Analytics
Amplitude analytics is a product analytics platform that helps businesses track and analyze user behavior and engagement to improve product strategies.

Key Features
- Offers quick automated reports through industry-specific templates
- Allows a wide range of analysis on top of event data like funnel analysis, cohort analysis, segmentation, etc.
- Predictive analytics. Some plans may include predictive analytics features that leverage machine learning to forecast user behavior and trends.
Pros
- Offers user behavior analysis, revenue analysis, and retention analysis capabilities
- Great event tracking capabilities to help you track specific events or actions within their applications
Cons
- You might need an expert’s help in making this implementation and updating the tool
- The cost of using Amplitude will increase with higher levels of data usage, and organizations with significant data volumes tend to find the pricing structure frustrating.
Rating
4.5/5
Zoho Analytics
Zoho Analytics is a business intelligence and analytics platform that allows you to connect, prepare, and analyze your product data on a massive scale.

Key Features
- Allows connecting to data from files, feeds, web URLs, databases, business apps, and other data sources
- Allows data type identification, data filtering and cleansing, data transformation, and enrichment without manual intervention
Pros
- It is a beginner-friendly platform with a simple and clean UI and UX
- Can integrate with major platforms like Salesforce, Microsoft Dynamics, HubSpot, as well as the Zoho ecosystem
Cons
- Limited free tier features. The free version of Zoho Analytics has limitations in terms of the number of users, data storage, and advanced features.
- Slower performance with large datasets. Users working with particularly large datasets tend to experience slower performance, and the platform may take longer to process and analyze extensive data.
Rating
4.2/5
UXCam
An intuitive mobile app analytics tool, UxCam is a platform that provides user experience analytics and insights for website and mobile app optimization.

Key Features
- Allows a set of features around session recordings, heatmaps, and replays
- Can integrate with Google Analytics, Firebase, and Segment
Pros
- Offers a free plan and free trial so that you can try it out comfortably
Cons
- Doesn’t offer advanced analysis capabilities beyond conversion and funnel analysis
Rating
4.2/5
LogRocket
LogRocket is a web application performance monitoring (APM) and user experience (UX) analytics tool. It allows product development teams to identify and troubleshoot issues within web applications through detailed insights into user interactions.

Key Features
- Allows real-time session playback and error tracking
- Error tracking: LogRocket monitors and tracks errors and exceptions that occur within web applications. It provides detailed error reports, including stack traces and contextual information about the user's actions leading up to the error.
Pros
- Custom events and analytics. LogRocket allows you to define and track custom events within the app.
- Offers a free trial so that you can try it out comfortably
Cons
- Upgrading to the premium plan might be expensive for small or new businesses
Rating
4.6/5
Pendo
Pendo is a product experience platform designed to help product teams and software developers understand user behavior within applications and improve the overall user experience.

Key Features
- Offers targeted walkthroughs and messaging within the app
- Allows prioritizing and managing customer feature requests using Pendo Feedback
Pros
- Can integrate with Figma, HubSpot, Jira, Microsoft Teams, Slack, Salesforce, Algolia, and Tableau
- Offers a free trial so that you can try it out comfortably
Cons
- Limited customization options for dashboards
Rating
4.4/5
Heap
Designed for medium to large-sized companies, Heap helps businesses capture user action taken on a website, automating user analytics reporting.

Key Features
- Auto capture events. Heap's auto-capture feature automatically tracks user interactions on web and mobile applications, eliminating the need for manual event tracking. This includes clicks, form submissions, pageviews, and other user actions.
- Can integrate with Shopify, Salesforce, and HubSpot
Pros
- Powerful event visualizer. The Event Visualizer tool simplifies the process of defining and tracking events visually. This can be particularly useful for non-technical users, enabling them to set up custom events without writing code.
Cons
- Can track front-end interactions only
- Cost. Heap is a paid service, and the cost may vary based on factors such as the size of the user base, the volume of data collected, and feature requirements.
Rating
4.4/5
Conclusion:

If you are looking for a product usage analytics tool, you can book a personalized demo with us here. Houseware is the 3rd generation of product analytics tools built right on top of the warehouse.